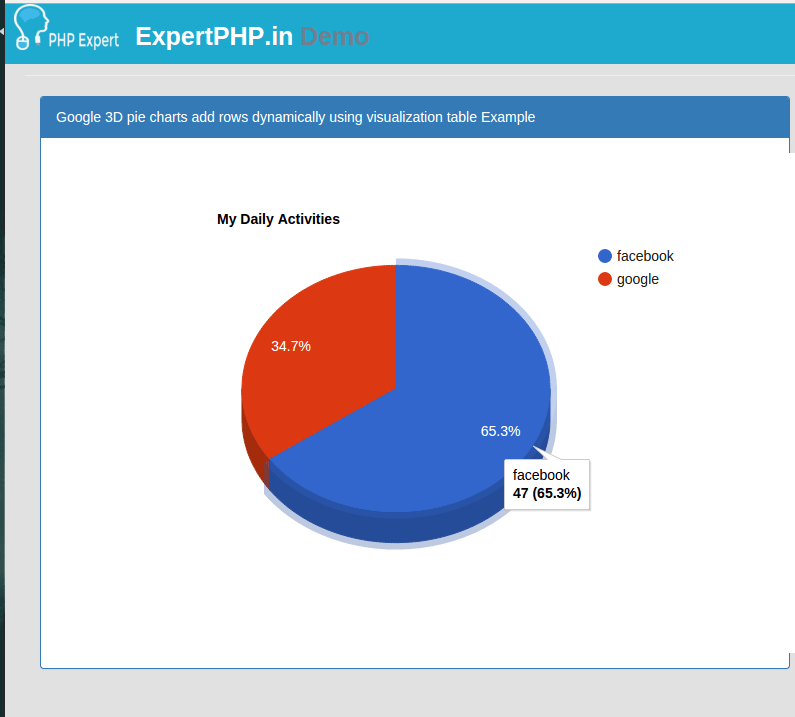
Google 3D pie charts add rows dynamically using visualization table in PHP Laravel Framework
In this tutorial, i will tell you following thing that i have used in google pie charts :
- Use of Google Pie Chart
- Pass Eloquent data from Controller to view and how can i get php value in script.
- How to add dynamically rows with two columns to a Google Pie Charts.
- About Google Visualization Data Table
- Use of event addListener in Google Pie Chart
Charts are mostly used to generate report to see the summary of details.
Here i have a user table with additional column source where user is registered from different source as facebook and google.
You can see some steps from here to Install Laravel, Create Table and Model
I display the total registered user of each source in google piechart.
I assume that you have install laravel in your system if don't have then install laravel first
Route and ControllerHere i define route google-piechart with get method that call ChartController with pieChart method.
- Route::get('google-piechart',array('as'=>'chart.piechart','uses'=>'ChartController@pieChart'));
- <?php
- namespace App\Http\Controllers;
- use Illuminate\Http\Request;
- use App\Http\Controllers\Controller;
- use App\User;
- class ChartController extends Controller {
- public function pieChart(){
- $social_users=User::selectRaw('count(source) as count,source')->groupBy('source')->get();
- $user=array();
- foreach ($social_users as $result) {
- $user[$result->source]=(int)$result->count;
- }
- return view('piechart',compact('user'));
- }
- }
You will notice that here i use selectRaw method that are used to write raw query while working with Laravel Eloquent.
Now create piechart.blade.php
- <script type="text/javascript" src="https://www.gstatic.com/charts/loader.js"></script>
- <script type="text/javascript">
- google.charts.load("current", {packages:["corechart"]});
- google.charts.setOnLoadCallback(drawChart);
- function drawChart() {
- var record={!! json_encode($user) !!};
- console.log(record);
- // Create our data table.
- var data = new google.visualization.DataTable();
- data.addColumn('string', 'Source');
- data.addColumn('number', 'Total_Signup');
- for(var k in record){
- var v = record[k];
- data.addRow([k,v]);
- console.log(v);
- }
- var options = {
- title: 'My Daily Activities',
- is3D: true,
- };
- var chart = new google.visualization.PieChart(document.getElementById('piechart_3d'));
- chart.draw(data, options);
- }
- </script>
- <div id="piechart_3d" style="width: 900px; height: 500px;"></div>
Now you can use this demo code in your application for Google pie chart.
You can customize option value as per need and add dynamic title and set click event to see full report too.
To use event addListener follow the syntax :
- google.visualization.events.addListener(chart, 'select', function() {
- var row = chart.getSelection()[0].row;
- var selected_data=data.getValue(row, 0);
- var url = "demo.expertphp/google-pie-chart?data="+selected_data ;
- window.open(url, '_blank');
- });
Click here to see the demo how it is working


.jpg)